Типология учебников русского языка на основе ReaderBench: уровневый и тематический подходы
Aннотация
Учебник является важным образовательным ресурсом для чтения в классе и самостоятельной работы, а качество учебных материалов определяет весь учебный процесс. Одним из наиболее важных факторов, которые следует учитывать, является их удобочитаемость и понятность. Поэтому правильное сочетание сложности учебника и уровня компетентности учащихся имеет первостепенное значение. В данной статье анализируются автоматизированные методы классификации русскоязычных учебников по двум измерениям, а именно по теме текста и его сложности, отражаемой соответствующим школьным уровнем (классом). Корпус исследования – 154 учебника, используемых для обучения в 2 – 11 классах Российской Федерации. Исследование осуществлено на основе методов машинного обучения с использованием индексов сложности текста, рассчитываемых при помощи многоязычной платформы с открытым исходным кодом ReaderBench и классификационными моделями на основе BERT. Кроме того, мы изучаем наиболее предиктивные функции ReaderBench в сочетании с контекстуальными вложениями от BERT. Наши результаты доказывают, что включение индексов сложности текста улучшает эффективность классификации моделей на основе BERT в нашем наборе данных, разделенном с использованием двух стратегий. В частности, показатель F1 для классификации по темам улучшился до 92,63 %, а показатель F1 для классификации по уровням обучения (классам) улучшился до 54,06 % для жадного алгоритма, при котором несколько смежных абзацев считаются единым текстовым блоком до тех пор, пока не будет достигнута максимальная длина абзаца, 512 токенов, для изучаемой языковой модели.
Ключевые слова: Читабельность текста, Русский язык, Анализ учебника, Тематическая классификация, Фреймворк ReaderBench, Индексы сложности текста, Языковая модель на основе преобразователя
К сожалению, текст статьи доступен только на Английском
Introduction
Despite the increased usage of electronic multimedia in education, such as video courses, audiobooks, or interactive online courses, textbooks are still among the most valuable and frequently employed educational materials, especially for early grade levels. Wakefield(2006) shows that 87-88% of US students report reading their textbooks in class at least once weekly. Textbooks are an essential resource for the classroom, where the teacher acts as a facilitator, and are also used in the home environment; as such, the entire learning process is guided by quality learning materials (Swanepoel,2010). Since the content of the textbooks has a major impact on the education system’s effectiveness (Khine,2013), their content and complexity level need careful attention from the research community. One of the most important factors to be analyzed when assessing textbooks is their readability and comprehensibility (Bansiong,2019). Therefore, the correct pairing of textbook complexity and student grade level has to be achieved. Using objective, computable parameters to rate the readability of textbooks in a highly competitive and saturated market is of invaluable help to any actor or stakeholder in the educational space.
The problem of readability and text complexity has long been outstanding in the research community. Early on, the approach was focused on using easy-to-obtain numerical quantification of the analyzed text and using them as input for an algorithmic approach. For example, Kincaid et al.(1975) introduced the Flesch–Kincaid readability index (FKI) as a measure of readability for English texts based on their structural features. More modern approaches, such as CohMetrix (Crossley et al.,2008), use text cohesion metrics to evaluate the readability of English texts for English as a second language (ESL) students. CohMetrix uses computational linguistic tools that provide a deeper insight into the structure of a text. Modern statistical approaches rely on many textual features, from simple shallow metrics and counts to more complex lexical, morphological, and syntactic features.
Nowadays, related works on text difficulty focus on various languages and topics. Chatzipanagiotidis et al.(2021) classified Greek as a second language corpus using a Sequential Minimal Optimization (SMO). For the Italian and English languages, DeepEva (Bosco et al.,2021) uses two long-short-term memory (LSTM) neural layers to classify English and Italian sentences according to their complexity. A simpler approach to compare Slovak and Canadian textbooks was used by Beníčková et al.(2021). The authors used simple formulas and counted to create syntactic and semantic text difficulty coefficients that were then aggregated to obtain a numerical score for text difficulty. Even so, the authors identified a larger proportion of technical terms in Slovak textbooks that unnecessarily increased the difficulty of those fragments.
For the Russian language, Batinic et al.(2017) used a Naive Bayes classifier to differentiate between three Russian levels as foreign language textbooks. They achieved 74% accuracy using several numerical features, such as FKI for the Russian language, counts of different parts of speech (POS), and the number of abstracta (i.e., abstract words per sentence) in texts. Solovyev et al.(2020a) considered a linguistic ontology, RuThes-Lite, to compute the complex features of the text on the Thesaurus graph for discrimination of the school grade level. Using the Russian Dictionary of Abstractness/Concreteness (Solovyev, Ivanov, and Akhtiamov,2019),Solovyev et al.(2020b) the authors proposed an online tool, RusAC, to assess the abstractness score of a Russian text. The authors argued that these indices are a good indicator of the topic of the text, whereas scientific texts tend to be more concrete. The analysis of the complexity of academic texts using textual indices was also addressed by Solovyev et al.(2018,2019);Churunina et al.(2020).Sakhovskiy et al.(2020) showed that text complexity, measured by the grade the textbook addresses, correlates with relevant topic features such as the coherence of topics, topics with semantically closer words, and the frequency of topic words. At the sentence level, Ivanov(2022) constructed a graph from the dependency tree and used BERT and Graph Neural Networks to predict the complexity at this level.
Numeric linguistic features have been proven reliable predictors of text complexity and text topic (Norris andOrtega,2009;Santucci et al.,2020;Zipitria et al.,2012). One example of a framework providing textual complexity indices available in Russian is Readerbench (Dascalu et al.,2017;Corlatescu et al.,2022), presented in detail in the following section.
ReaderBench Textual Complexity Indices
Readerbench provides over 500 indices for the Russian language[1] divided into three levels of granularity: sentence level (Sent), paragraph level (Par), and document level (Doc). Additionally, there are three methods of aggregation: mean (M), maximum (Max), and standard deviation (SD). These indices are further referenced by abbreviations such as “M (UnqWd / Par),” representing the mean value of unique words per paragraph. The framework provides several classes of indices, including surface, word, morphology, syntax, and cohesion indices, as presented in Table 1.
Surface indices are simple normalized counts that do not consider the content of the text. These range from the number of words per document, paragraph, or sentence to the entropy of words (Shannon,1948;Brown et al.,1992). Word indices provide insights into individual words, their length, how different their lemma is from the inflected form, or if the word stands for a specific named entity such as locations (LOC), persons (PER), or organizations (ORG).
More complex indices are based on part-of-speech (POS) tagging, such as the morphology category or the syntactic indices based on the results of syntactic dependency parsers. A key constituent when assessing text difficulty is text cohesion computed using the Cohesion Network Analysis (CNA) graph (Dascalu et al.,2018). This cohesion category helps distinguish between textbooks that pose a higher challenge to the reader than others by highlighting cohesion gaps or low cohesion segments.
Text pre-processing from ReaderBench, including POS tagging, dependency parsing, and named entity recognition, relies on spaCy, while the CNA graph is built using BERT-based models. For this analysis, we considered Russian spaCy models[2] (i.e., “ru_core_news_lg”) and RuBERT (Kuratov and Arkhipov,2019), part of the DeepPavlov library[3].
Table 1. Available indices in the Readerbench framework for the Russian language
Таблица 1. Доступные для русского языка индексы Readerbench

Research Objective
Our research objective is to analyze the predictive power of state-of-the-art models on both the horizontal (i.e., topic) and the vertical dimensions (i.e., complexity derived from school grade level) of textbooks written in the Russian language. As such, we analyze 154 Russian language textbooks covering 10 school grades from the 2nd to 11th grades across 13 topics ranging from STEM subjects, such as Maths and Physics, to humanities and social sciences. We explore several textual complexity indices and Cohesion Network Analysis features from ReaderBench and their contribution to classifying the aforementioned textbooks. Additionally, we consider large Russian language models, such as RuBERT (Kuratov and Arkhipov,2019), in conjunction with the selected features and compare their performance with the stand-alone model based only on the textual complexity indices.
We open-source our code at https://github.com/readerbench/rus-textbooks and our best models for both grade level and topic classifications at https://huggingface.co/readerbench/ru-textbooks.
Method
Textbooks Corpus
This study considers a stable version from February 2023 of the corpus elaborated by the linguistic experts from the Text Analytics Laboratory, Institute of Philology and Intercultural Communication, Kazan. The dataset consists of 154 Russian textbooks distributed across 10 school grade levels and 13 different subjects – this later task is also called topic classification. Table 2 shows that the topics are not evenly distributed across the grades. Subjects such as Arts, Music, Maths, Science, and Technology are not present above the 4th grade in the corpus. In contrast, Biology, Geography, History, Physics, and Social Studies are only present after the 4th grade. For Biology, a special case refers to the 10th and 11th grades, where all three textbooks were evenly spread across both grades; since a clear separation could not be established, we associated all these three books with the 10th grade.
Table 2. Textbook distribution over grades and topics
Таблица 2. Распределение учебников по классам и темам

The input sequence length is limited for RuBERT to 512 tokens, corresponding to an average of 300 to 350 words. Since the average number of tokens per textbook far exceeds this limit (see Table 3), the entire document cannot be used as the classification unit. For this, we experimented with two document-splitting strategies.
Table 3. Average number of paragraphs, words, and tokens per textbook and subject
Таблица 3. Среднее количество абзацев, слов и токенов на учебник и предмет

The first strategy selects individual paragraphs in their occurrence order within each textbook, while the second approach appends subsequent paragraphs in a Greedy manner just before they exceed 512 tokens. Inherently, the extracted text units are coherent since they contain full paragraphs with fully expressed ideas. Given the distribution of paragraph lengths (M = 36.12 tokens per paragraph and SD = 38.55), both strategies produce classification units under 512 tokens. There were only 64 paragraphs in all textbooks that exceeded 512 tokens. These were split into smaller chunks that followed sentence splits and would fit into the model input. After splitting the data into classification units, we obtain the class distributions in Table 4 and in Table 5. We notice that the topic classes are highly imbalanced regardless of the splitting strategy, with limited data for Arts, Ecology, and Music. The text distribution across school grade levels is much more balanced but still has fewer examples for the 2nd and 6th grades.
Table 4. Class distribution for subjects after splitting the documents using the two approaches
Таблица 4. Распределение классов по темам после разделения документов с использованием двух подходов

Table 5. Class distribution across grade levels after splitting the documents using the two approaches
Таблица 5. Распределение классов по уровням обучения после разделения документов с использованием двух подходов

We created 3 stratified folds with an 80-20% train-test split, used as independent evaluations that considered having different textbooks in the test set to avoid data contamination. As such, we ensured that each fold per subject or grade level had different books in the test set, with at least one for each subject, thus limiting the effect of artificially improving performance since similar paragraphs would have been encountered during training.
ReaderBench Feature Selection
We computed the textual indices for each classification unit using the previously mentioned text splits. Since none of the records represent an entire document, we discarded all document-based indices and kept only paragraph-, sentence-, and word-based values. Additionally, we removed any indices with a zero-standard deviation since these denote no variance and do not provide any valuable insights for classification.
Since the Shapiro-Wilk normality test (Shapiro and Wilk,1965) did not confirm a normal distribution for most indices, we employed the Kruskal-Wallis (Kruskal and Wallis,1952) to identify statistically significant indices for the target classes. Since our analysis is both horizontal based on the textbook topic and vertical, using the school grade for which the book was written, we employed two lists of indices, one for topic classification and another for grade classification. Also, we compile a subset for each list since the indices differ between the 2 splits (i.e., Paragraph and Greedy). As we can observe in Table 6 and in Table 7, splitting texts by paragraph leads to more indices being statistically non-significant.
Table 6. Statistically significant indices for Grade classification for each of the text-splitting strategies
Таблица 6. Статистически значимые индексы для уровневой (по классам) классификации для каждой из стратегий разделения текста

Table 7. Statistically significant indices for Topic classification for each text splitting strategy
Таблица 7. Статистически значимые индексы для тематической классификации для каждой стратегии разделения текста

We observe that most nonpredictive indices are based on standard deviations, which is to be expected since this split leads to an increased number of shorter texts per document; thus, less variance is explained between the classification units. In contrast, the Greedy split leads to almost all indices being significantly different between the classes. According to the Kruskal-Wallis test, the most significant index was M (Dep amod / Par) for Topic and Grade classifications using both split text strategies. Afterward, Max (Dep amod / Par) for the Paragraph split and M (UnqPOS adj / Par) for the Greedy text split are the most predictive specific indices. Overall, differences are determined by the degree of descriptive elements from the text (i.e., NmdEnd_loc) and a more diverse vocabulary (i.e., WdEntr).
Classification Models
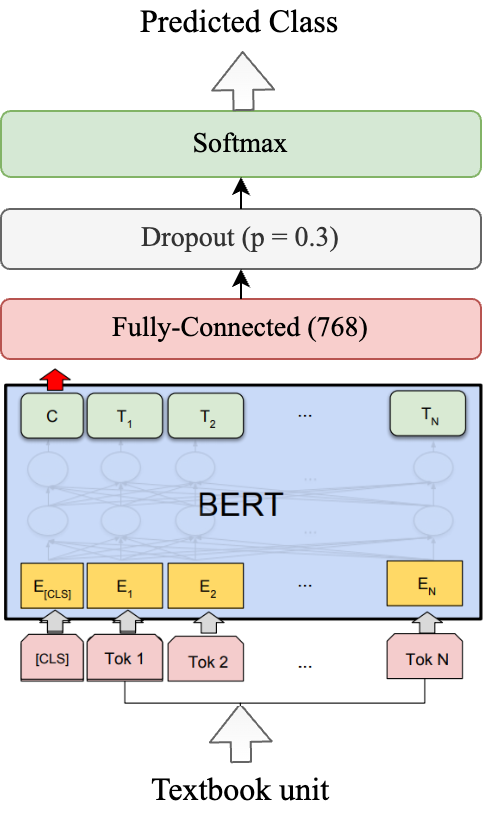
This study focuses on two types of multiclass classification for which we employ various methods (see Figure 1): based on the textbook topic (i.e., a 13-class classification) and the textbook school grade (i.e., a 10-class classification).
First, we consider a Random Forest classifier as a baseline to identify topics and grades based only on linguistic indices (see Figure 1.a). In order to identify a good set of hyperparameters, we perform a grid search over the number of estimators, minimum numbers of samples required to be a leaf, minimum number of samples required to split a node, number of features considered for the best split, and the maximum tree depth.
Figure 1. The three considered architectures
Рисунок 1. Три архитектуры исследования
a

b
c
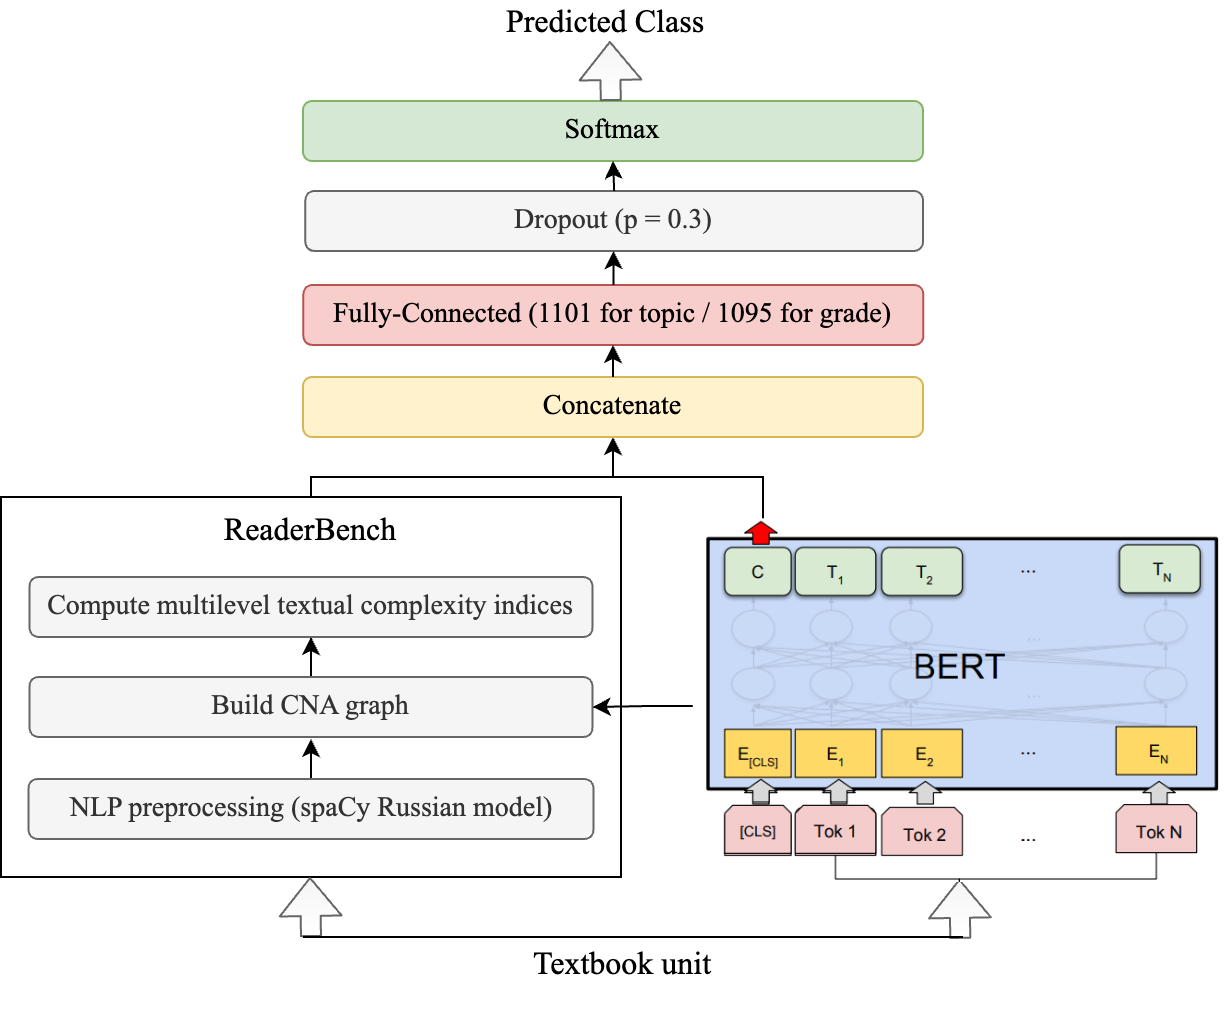
Second, we use two BERT-based models. The first neural model uses only the RuBERT model and a linear, fully connected classifier with 768 dimensions over the pooled CLS token (see Figure 1.b) and a dropout layer with 0.3 probability. The second neural model concatenates the textual features for the classified samples to the pooled CLS token before being fed into the linear classifier (see Figure 1.c).
Experimental Setup
Both BERT-based models were trained using an AdamW optimizer with a learning rate of 1e-5. Since the classes were imbalanced, we used a weighted cross-entropy loss. Due to the difference in average text length between the Paragraph and the Greedy split, we used different maximum sequence lengths for each one, respectively 64 for the Paragraph and 512 for the Greedy split. The models were trained with early stopping for validation loss and patience of 2. Each model was trained on all three folds and we report the average values for accuracy, class-weighted average precision, recall, and F1 scores of all three runs.
Results
Table 8 and Table 9 present the classification results for each employed model. As expected, BERT-based models perform considerably better than classical machine learning models, such as Random Forest. Also, the way we pre-process the documents plays a significant role. The Greedy split performs notably better than a simple paragraph split for both topic and grade classifications. Since Transformer models create contextualized embeddings, providing larger windows for the classification of textbooks proves especially efficient. The performance gain for topic classification is more than 15% F1 score for the plain RuBERT model and over 12% for RuBERT enhanced with complexity indices. Similarly, the improvement is over 15% for both BERT-based models in the grade classification task.
Table 8. Classification results for topic classification. Metrics are computed as the average over three different folds
Таблица 8. Результаты классификации для тематической классификации. Метрики рассчитываются как среднее по трем архитектурам.

Table 9. Classification results for grade classification. Metrics are computed as the average over three different folds
Таблица 9. Результаты классификации по классам. Метрики рассчитываются как среднее по трем архитектурам.

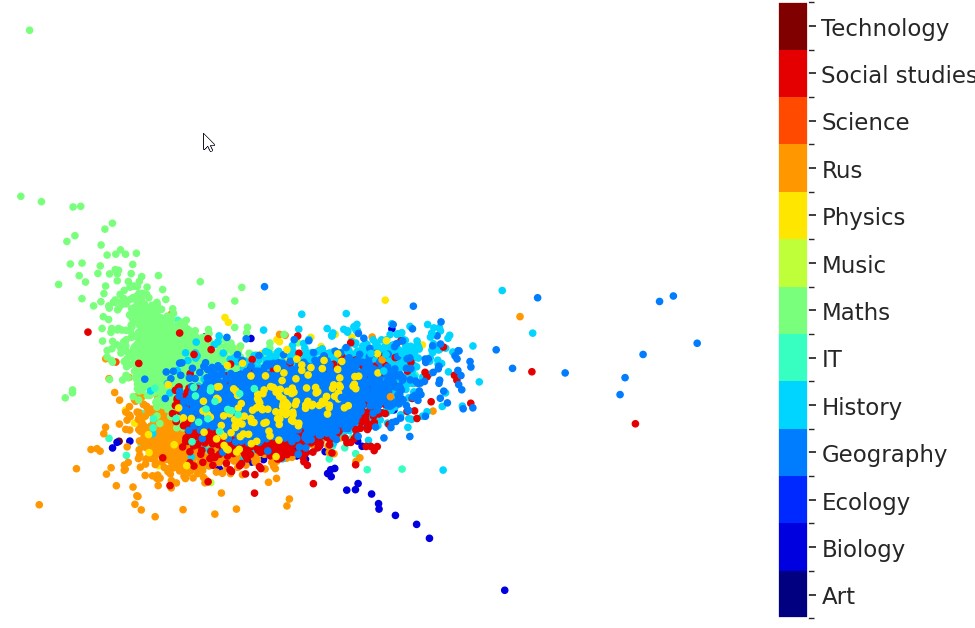
The difference between these two splitting strategies can also be observed in the Linear Discriminant Analysis (LDA) projection (Xanthopoulos et al.,2013) of the significant indices for topic classification. The classes are much better delimited for the Greedy text split (see Figure 2.b) than for the Paragraph split (see Figure 2.a).
Additionally, adding textual complexity indices greatly improves the grade classification performance, with over 2% weighted F1 score. For Topic classification, the indices improve the model only marginally since both BERT-based models perform exceptionally well, achieving an F1 score of over 92%.
Figure 2. LDA projection for the significant textual indices clustered for topic classification
Рисунок 2. Проекция LDA для значимых текстовых индексов, сгруппированных для тематической классификации.
a
b

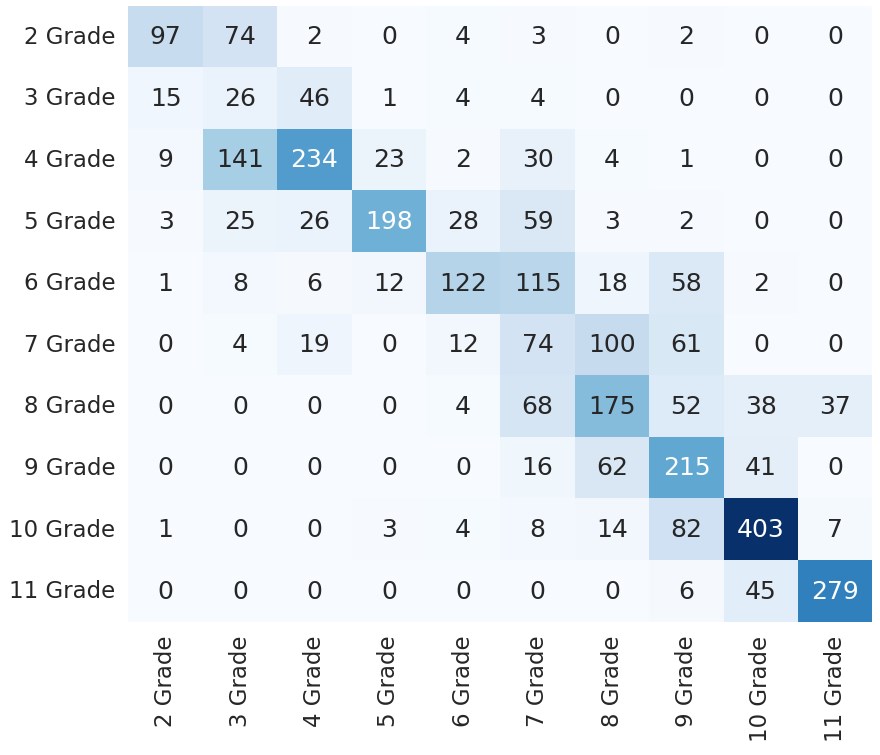
The confusion matrix for topic classification (see Figure 3.a) highlights that most errors are for Ecology, Geography, IT, and Social Studies. Since Ecology has only 3 textbooks, being the most imbalanced of the classes, a higher error rate was expected. Also, the model identified the Ecology fragments as Biology, which is plausible without a larger context. We also noticed the same type of error for IT, where the model placed 17 fragments as Technology. An interesting pattern of errors emerges in the grade classification confusion matrix in Figure 3.b. We can observe that the erroneous predictions tend to bleed into the neighboring grades, most going around the matrix diagonal. This is easily arguable since textbook complexity is on a continuum throughout school grades; as such, there should be no sudden jumps in complexity between consecutive grades. We can also observe that the 10th and 11th grade levels are best predicted since these levels have textbooks from only 4 of the 13 topics, and there is less noise due to the changing of domains between the fragments.
Figure 3. Confusion matrices for the best model considering RuBERT+Features
Рисунок 3. Матрицы смешивания для лучшей модели с учетом архитектуры RuBERT+Features
a

b
Discussion
This study provides insights into the school textbook corpus of the Russian language that, in its current versions, spans 13 topics and 10 school grades. Our results show that Transformer-based models, such as RuBERT, can be used to identify the textbook topic with very high accuracy. We argue that textual complexity indices add to the robustness of the model and even increase its performance. Since the simple RuBERT model already achieves high accuracy (about 92.84%), any additional improvement was expected to be quite low.
The grade level classification has proven to be more difficult, with accuracy for the simple RuBERT model up to 52.07% over all the 10 classes. Here, we notice a much greater impact of the textual indices. Additionally, we show that our best-trained model struggles to differentiate between adjacent grade levels, with an adjacent accuracy for the best model reaching 85.61% when compared to its precise accuracy of 56.30%. This can be due to incremental increases in complexity between grades or to the practice of recapitulating some of the topics discussed in the previous grade at the beginning of the textbooks. This last assumption is supported by the fact that most erroneous classified fragments are from the first 50 paragraphs from all textbooks, with a median of 57, in contrast to the median of 69 paragraphs for the entire corpus. A Kruskal-Wallis test on paragraph identifiers with erroneous classification rejects the null hypothesis with p < .05 and χ2=24.84, showing that paragraph identifiers with a higher error rate are lower on average is significant.
Conclusions and Future Work
In this study, we address the classification of Russian textbooks based on their topic and corresponding grade level. We show that using Transformer-based large language models supports the identification with very high accuracy of the school subject. Further, we present a classification method to predict the grade level of a text fragment with reasonably high accuracy. We show that both classification tasks achieved improved performance using the textual complexity indices from the open-source ReaderBench framework. Our best-performing BERT-based model enhanced with textual indices achieved a 92.63% F1 score on the 13 class topic classification and a 54.06% F1 score on the 10 class grade level classification.
In future work, we aim to improve the classification capabilities for grade-level detection by exploring further textbook datasets with more balanced coverage of the topics across all grade levels. Additionally, we will experiment with Graph Neural Networks like VGCN-BERT (Lu et al.,2020) that better capture the global information about the vocabulary, as well as large encoder-decoder language models like Flan-T5 (Chung et al.,2022) that were fine tuned on several tasks and achieved state-of-the-art performance. Lastly, we plan to expand the ReaderBench framework with indices proposed by (Solovyev et al., 2020 a, b) to cover Slavic languages better and enhance its multilingual capabilities.
Благодарности
Работа выполнена при поддержке гранта Министерства исследований, инноваций и цифровизации, проект CloudPrecis, номер договора 344/390020/06.09.2021, код MySMIS: 124812, в рамках POC. Выражаем благодарность НИЛ "Текстовая аналитика" Казанского (Приволжского) федерального университета за помощь в составлении корпуса и сотрудничество при проведении исследования.











Список литературы
Список использованной литературы появится позже.